Zero to One with Flutter, Part Two
Discovering how to animate composite graphical objects in the context of a cross-platform mobile app. Join an avid concept miner in…

Discovering how to animate composite graphical objects in the context of a cross-platform mobile app. Join an avid concept miner in learning how to apply the tween concept to animation of structured values, exemplified by bar charts. Full code samples, batteries included.
Edit: updated for Dart 2 on August 8, 2018. GitHub repo and diff links added on October 17, 2018.
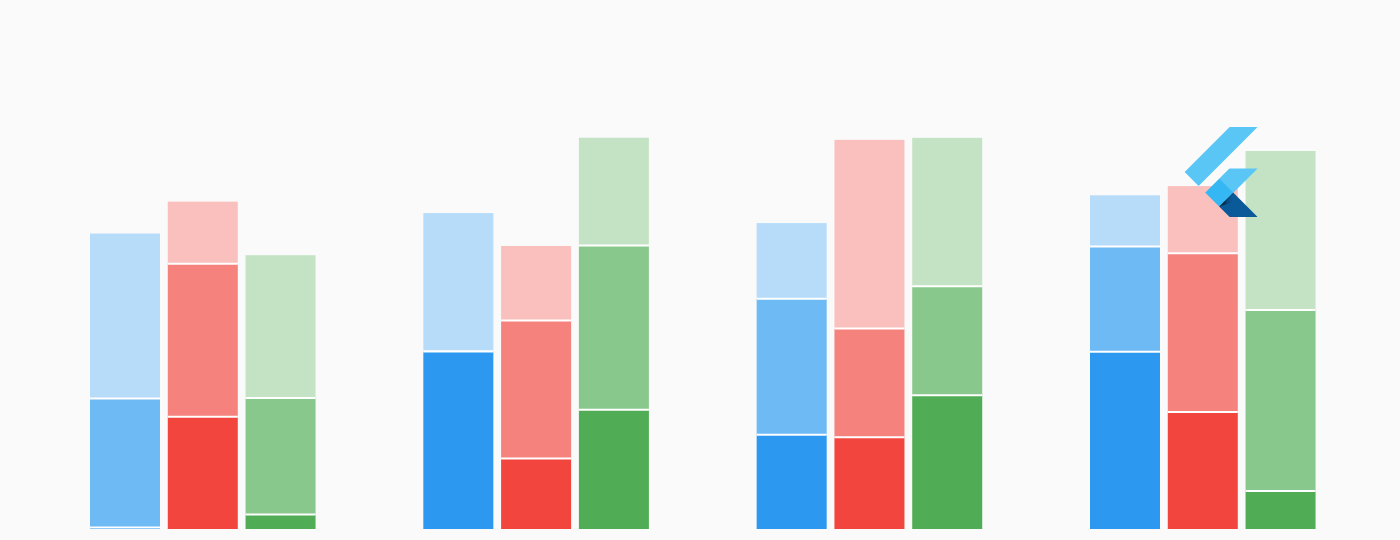
How do you enter into a new field of programming? Experimentation is obviously key, as is studying and emulating programs written by more experienced peers. I personally like to complement these approaches with concept mining: Trying to work from first principles, identifying concepts, exploring their strength, deliberately seeking their guidance. It is a rationalistic approach which cannot stand on its own, but one that is intellectually stimulating and may lead you to deeper insights faster.
This is the second and final part of an introduction to Flutter and its widget and tween concepts. At the end of part one, we arrived at a widget tree containing, among various layout and state-handling widgets,
a widget for painting a single
Barusing custom, animation-aware drawing code,a floating action button widget for initiating an animated change of the bar’s height.
The animation was implemented using a BarTween, and I claimed that the tween concept would scale to handle more complex situations. Here in part two, I’ll fulfill that claim by generalizing the design to bars with more properties, and to bar charts containing multiple bars in various configurations.
Let’s start by adding color to our single bar. We add a color field next to the height
field of the Bar class, and update Bar.lerp to lerp both of them. This pattern is typical:
Lerp between composite values by lerping corresponding components.
Recall from part one that “lerp” is a short form of “linearly interpolate” or “linear interpolation”.
import 'dart:ui' show lerpDouble;
import 'package:flutter/animation.dart';
import 'package:flutter/material.dart';
class Bar {
Bar(this.height, this.color);
final double height;
final Color color;
static Bar lerp(Bar begin, Bar end, double t) {
return Bar(
lerpDouble(begin.height, end.height, t),
Color.lerp(begin.color, end.color, t),
);
}
}
class BarTween extends Tween<Bar> {
BarTween(Bar begin, Bar end) : super(begin: begin, end: end);
@override
Bar lerp(double t) => Bar.lerp(begin, end, t);
}
Notice the utility of the static lerp method idiom here. Without Bar.lerp,
lerpDouble (morally double.lerp), and Color.lerp we’d have to implement
BarTween by creating a Tween<double> for the height and a Tween<Color>
for the color. Those tweens would be instance fields of BarTween, initialized by its constructor, and used in its
lerp method. We’d be duplicating knowledge about the properties of Bar several times over, outside the
Bar class. Maintainers of our code would likely find that less than ideal.
To make use of colored bars in our app, we’ll update BarChartPainter to get the bar color from the
Bar. In main.dart, we need to be able to create an empty Bar and a random
Bar. We’ll use a fully transparent color for the former, and a random color for the latter. Colors will be taken from a simple
ColorPalette which we quickly introduce in a file of its own. We’ll make both Bar.empty
and Bar.random factory constructors on Bar (code listing,
diff).
Bar charts involve multiple bars in various configurations. To introduce complexity slowly, our first implementation will be suitable for bar charts displaying numeric quantities for a fixed set of categories. Examples include visitors per weekday or sales per quarter. For such charts, changing the data set to another week or another year does not change the categories used, only the bar shown for each category.
We’ll update main.dart first this time, replacing Bar by BarChart
and BarTween by BarChartTween (code listing,
diff).
To make the Dart analyzer happy, we create the BarChart class in bar.dart and implement it using a fixed-length list of
Bar instances. We’ll use five bars, one for each day of the workweek. We then need to move the responsibility for creating empty and random instances from
Bar to BarChart. With fixed categories, an empty bar chart is reasonably taken to be a collection of empty bars. On the other hand, letting a random bar chart be a collection of random bars would make our charts rather kaleidoscopic. Instead, we’ll choose a random color for the chart and let each bar, still of random height, inherit that.
import 'dart:math';
import 'dart:ui' show lerpDouble;
import 'package:flutter/animation.dart';
import 'package:flutter/material.dart';
import 'color_palette.dart';
class BarChart {
static const int barCount = 5;
BarChart(this.bars) {
assert(bars.length == barCount);
}
factory BarChart.empty() {
return BarChart(List.filled(
barCount,
Bar(0.0, Colors.transparent),
));
}
factory BarChart.random(Random random) {
final Color color = ColorPalette.primary.random(random);
return BarChart(List.generate(
barCount,
(i) => Bar(random.nextDouble() * 100.0, color),
));
}
final List<Bar> bars;
static BarChart lerp(BarChart begin, BarChart end, double t) {
return BarChart(List.generate(
barCount,
(i) => Bar.lerp(begin.bars[i], end.bars[i], t),
));
}
}
class BarChartTween extends Tween<BarChart> {
BarChartTween(BarChart begin, BarChart end) : super(begin: begin, end: end);
@override
BarChart lerp(double t) => BarChart.lerp(begin, end, t);
}
class Bar {
Bar(this.height, this.color);
final double height;
final Color color;
static Bar lerp(Bar begin, Bar end, double t) {
return Bar(
lerpDouble(begin.height, end.height, t),
Color.lerp(begin.color, end.color, t),
);
}
}
class BarTween extends Tween<Bar> {
BarTween(Bar begin, Bar end) : super(begin: begin, end: end);
@override
Bar lerp(double t) => Bar.lerp(begin, end, t);
}
class BarChartPainter extends CustomPainter {
static const barWidthFraction = 0.75;
BarChartPainter(Animation<BarChart> animation)
: animation = animation,
super(repaint: animation);
final Animation<BarChart> animation;
@override
void paint(Canvas canvas, Size size) {
void drawBar(Bar bar, double x, double width, Paint paint) {
paint.color = bar.color;
canvas.drawRect(
Rect.fromLTWH(x, size.height - bar.height, width, bar.height),
paint,
);
}
final paint = Paint()..style = PaintingStyle.fill;
final chart = animation.value;
final barDistance = size.width / (1 + chart.bars.length);
final barWidth = barDistance * barWidthFraction;
var x = barDistance - barWidth / 2;
for (final bar in chart.bars) {
drawBar(bar, x, barWidth, paint);
x += barDistance;
}
}
@override
bool shouldRepaint(BarChartPainter old) => false;
}
The BarChartPainter distributes available width evenly among the bars and makes each bar take up 75% of the width available to it.

Notice how BarChart.lerp is implemented in terms of Bar.lerp, regenerating the list structure on the fly. Fixed-category bar charts are composite values for which straightforward component-wise lerping makes sense, precisely as for single bars with multiple properties (diff).
There is a pattern at play here. When a Dart class’s constructor takes multiple parameters, you can often lerp each parameter separately and the combination will look good, too. And you can nest this pattern arbitrarily: dashboards would be lerped by lerping their constituent bar charts, which are lerped by lerping their bars, which are lerped by lerping their height and color. And colors are lerped by lerping their RGB and alpha components. At the leaves of this recursion, we lerp numbers.
The mathematically inclined might express this by saying that lerping commutes with structure in the sense that for composite values
*C*(*x*, *y*) we have
*lerp*(*C*(*x*1, *y*1), *C*(*x*2, *y*2), *t*) == *C*(*lerp*(*x*1, *x*2, *t*), *lerp*(*y*1, *y*2, *t*))
As we have seen, this generalizes nicely from two components (height and color of a bar) to arbitrarily many components (the n bars of a fixed-category bar chart).
There are, however, situations in which this pretty picture breaks down. We may wish to animate between two values that are not composed in quite the same way. As a simple example, consider animating from a bar chart with data for the five days of the workweek to a chart including also the weekend.
You might readily come up with several different ad-hoc solutions to this problem, and might then go ask your UX designer to choose between them. That’s a valid approach, though I believe it pays to keep in mind during your discussion the fundamental structure common to those different solutions: The tween. Recall from part one:
Animate Ts by tracing out a path in the space of all Ts as the animation value
runs from zero to one. Model the path with a Tween<T>.
The central question to answer with the UX designer is this: What are the intermediate values between a chart with five bars and one with seven? An obvious choice is to have six bars, but we need more intermediate values than that to animate smoothly. We need to draw bars differently, stepping outside the realm of equal-width, uniformly spaced bars, fitted to 200 pixels. In other words, the space of
T values must be generalized.
Lerp between values with different structure by embedding them into a space of more general values, encompassing as special cases both animation end points and all intermediate values needed.
We can do this in two steps. First, we generalize Bar to include its x coordinate and width as attributes:
class Bar {
Bar(this.x, this.width, this.height, this.color);
final double x;
final double width;
final double height;
final Color color;
static Bar lerp(Bar begin, Bar end, double t) {
return Bar(
lerpDouble(begin.x, end.x, t),
lerpDouble(begin.width, end.width, t),
lerpDouble(begin.height, end.height, t),
Color.lerp(begin.color, end.color, t),
);
}
}
Second, we make BarChart support charts with different bar counts. Our new charts will be suitable for data sets where bar
i represents the ith value in some series like sales on day i after a product launch.
Counting as programmers, any such chart involves a bar for each integer value 0..n, but the bar count
n may be different from one chart to the next.
Consider two charts with five and seven bars, respectively. The bars for their five common categories, 0..5, can be animated compositionally as we’ve seen above. The bars with index 5 and 6 have no counterpart in the other animation end point, but as we are now free to give each bar its own position and width, we can introduce two invisible bars to play that role. The visual effect is that bars 5 and 6 grow into their final appearance as the animation proceeds. Animating in the other direction, bars 5 and 6 would diminish or fade into invisibility.
Lerp between composite values by lerping corresponding components. Where a component is missing in one end point, use an invisible component in its place.
There are often several ways to choose invisible components. Let’s say our friendly UX designer has decided to use zero-width, zero-height bars with
x coordinate and color inherited from their visible counterpart. We’ll add a method to Bar
for creating such a collapsed version of a given instance.
class BarChart {
BarChart(this.bars);
final List<Bar> bars;
static BarChart lerp(BarChart begin, BarChart end, double t) {
final barCount = max(begin.bars.length, end.bars.length);
final bars = List.generate(
barCount,
(i) => Bar.lerp(
begin._barOrNull(i) ?? end.bars[i].collapsed,
end._barOrNull(i) ?? begin.bars[i].collapsed,
t,
),
);
return BarChart(bars);
}
Bar _barOrNull(int index) => (index < bars.length ? bars[index] : null);
}
class BarChartTween extends Tween<BarChart> {
BarChartTween(BarChart begin, BarChart end) : super(begin: begin, end: end);
@override
BarChart lerp(double t) => BarChart.lerp(begin, end, t);
}
class Bar {
Bar(this.x, this.width, this.height, this.color);
final double x;
final double width;
final double height;
final Color color;
Bar get collapsed => Bar(x, 0.0, 0.0, color);
static Bar lerp(Bar begin, Bar end, double t) {
return Bar(
lerpDouble(begin.x, end.x, t),
lerpDouble(begin.width, end.width, t),
lerpDouble(begin.height, end.height, t),
Color.lerp(begin.color, end.color, t),
);
}
}

Integrating the above code into our app involves redefining BarChart.empty and BarChart.random
for this new setting. An empty bar chart can now reasonable be taken to contain zero bars, while a random one might contain a random number of bars all of the same randomly chosen color, and each having a randomly chosen height. But since position and width are now part of the definition of
Bar, we need BarChart.random to specify those attributes too. It seems reasonable to provide
BarChart.random with the chart Size parameter, and then relieve BarChartPainter.paint
of most of its calculations (code listing,
diff).
The astute reader may have noticed a potential inefficiency in our definition of BarChart.lerp
above. We are creating collapsed Bar instances only to be given as arguments to Bar.lerp, and that happens repeatedly, for every value of the animation parameter
t. At 60 frames per second, that could mean a lot of Bar instances being fed to the garbage collector, even for a relatively short animation. There are alternatives:
-
Collapsed
Barinstances can be reused by being created only once in theBarclass rather than on each call tocollapsed. This approach works here, but is not generally applicable. -
The reuse can be handled by
BarChartTweeninstead, by having its constructor create a list_tweenofBarTweeninstances used during the creation of the lerped bar chart:(i) => _tweens[i].lerp(t). This approach breaks with the convention of using staticlerpmethods throughout. There is no object involved in the staticBarChart.lerpin which to store the tween list for the duration of the animation. TheBarChartTweenobject, by contrast, is perfectly suited for this. -
A
nullbar can be used to represent a collapsed bar, assuming suitable conditional logic inBar.lerp. This approach is slick and efficient, but does require some care to avoid dereferencing or misinterpretingnull. It is commonly used in the Flutter SDK where staticlerpmethods tend to acceptnullas an animation end point, typically interpreting it as some sort of invisible element, like a completely transparent color or a zero-size graphical element. As the most basic example,lerpDoubletreatsnullas zero, unless both animation end-points arenull.
The snippet below shows the code we would write following the null approach:
class BarChart {
BarChart(this.bars);
final List<Bar> bars;
static BarChart lerp(BarChart begin, BarChart end, double t) {
final barCount = max(begin.bars.length, end.bars.length);
final bars = List.generate(
barCount,
(i) => Bar.lerp(begin._barOrNull(i), end._barOrNull(i), t),
);
return BarChart(bars);
}
Bar _barOrNull(int index) => (index < bars.length ? bars[index] : null);
}
class BarChartTween extends Tween<BarChart> {
BarChartTween(BarChart begin, BarChart end) : super(begin: begin, end: end);
@override
BarChart lerp(double t) => BarChart.lerp(begin, end, t);
}
class Bar {
Bar(this.x, this.width, this.height, this.color);
final double x;
final double width;
final double height;
final Color color;
static Bar lerp(Bar begin, Bar end, double t) {
if (begin == null && end == null)
return null;
return Bar(
lerpDouble((begin ?? end).x, (end ?? begin).x, t),
lerpDouble(begin?.width, end?.width, t),
lerpDouble(begin?.height, end?.height, t),
Color.lerp((begin ?? end).color, (end ?? begin).color, t),
);
}
}
I think it’s fair to say that Dart’s ? syntax is well suited to the task. But notice how the decision to use collapsed (rather than, say, transparent) bars as invisible elements is now buried in the conditional logic in
Bar.lerp. That is the main reason I chose the seemingly less efficient solution earlier. As always in questions of performance vs maintainability, your choice should be based on measurements.
We have one more step to take before we can tackle bar chart animation in full generality. Consider an app using a bar chart to show sales by product category for a given year. The user can select another year, and the app should then animate to the bar chart for that year. If the product categories were the same for the two years, or happened to be the same except for some additional categories shown to the right in one of the charts, we could use our existing code above. But what if the company had product categories A, B, C, and X in 2016, but had discontinued B and introduced D in 2017? Our existing code would animate as follows:
2016  2017
  A -> A
  B -> C
  C -> D
  X -> X
The animation might be beautiful and silky-smooth, but it would still be confusing to the user. Why? Because it doesn’t preserve semantics. It transforms a graphical element representing product category B into one representing category C, while the one for C goes elsewhere. Just because 2016 B happens to be drawn in the same position where 2017 C later appears doesn’t imply that the former should morph into the latter. Instead, 2016 B should disappear, 2016 C should move left and morph into 2017 C, and 2017 D should appear on its right. We can implement this mingling using one of the oldest algorithms in the book: merging sorted lists.
Lerp between composite values by lerping semantically corresponding components. When components form sorted lists, the merge algorithm can bring such components on a par, using invisible components as needed to deal with one-sided merges.
All we need is to make Bar instances mutually comparable in a linear order. Then we can merge them as follows:
  static BarChart lerp(BarChart begin, BarChart end, double t) {
    final bars = <Bar>[];
    final bMax = begin.bars.length;
    final eMax = end.bars.length;
    var b = 0;
    var e = 0;
    while (b + e < bMax + eMax) {
      if (b < bMax && (e == eMax || begin.bars[b] < end.bars[e])) {
        bars.add(Bar.lerp(begin.bars[b], begin.bars[b].collapsed, t));
        b++;
      } else if (e < eMax && (b == bMax || end.bars[e] < begin.bars[b])) {
        bars.add(Bar.lerp(end.bars[e].collapsed, end.bars[e], t));
        e++;
      } else {
        bars.add(Bar.lerp(begin.bars[b], end.bars[e], t));
        b++;
        e++;
      }
    }
    return BarChart(bars);
  }

Concretely, we’ll assign each bar a sort key in the form of an integer rank attribute. The rank can then be conveniently used also to assign each bar a color from the palette, allowing us to follow the movement of individual bars in the animation demo.
A random bar chart will now be based on a random selection of ranks to include (code listing, diff).
This works nicely, but is perhaps not the most efficient solution. We are repeatedly executing the merge algorithm in
BarChart.lerp, once for every value of t. To fix that, we’ll implement the idea mentioned earlier to store reusable information in
BarChartTween.
class BarChartTween extends Tween<BarChart> {
BarChartTween(BarChart begin, BarChart end) : super(begin: begin, end: end) {
final bMax = begin.bars.length;
final eMax = end.bars.length;
var b = 0;
var e = 0;
while (b + e < bMax + eMax) {
if (b < bMax && (e == eMax || begin.bars[b] < end.bars[e])) {
_tweens.add(BarTween(begin.bars[b], begin.bars[b].collapsed));
b++;
} else if (e < eMax && (b == bMax || end.bars[e] < begin.bars[b])) {
_tweens.add(BarTween(end.bars[e].collapsed, end.bars[e]));
e++;
} else {
_tweens.add(BarTween(begin.bars[b], end.bars[e]));
b++;
e++;
}
}
}
final _tweens = <BarTween>[];
@override
BarChart lerp(double t) => BarChart(
List.generate(
_tweens.length,
(i) => _tweens[i].lerp(t),
),
);
}
We can now remove the static BarChart.lerp method (diff).
Let’s summarize what we’ve learned about the tween concept so far:
Animate Ts by tracing out a path in the space of all Ts as the animation value
runs from zero to one. Model the path with a Tween<T>.
Generalize the T concept as needed until it encompasses all animation end points and intermediate values.
Lerp between composite values by lerping corresponding components.
-
The correspondence should be based on semantics, not on accidental graphical co-location.
-
Where a component is missing in one animation end point, use an invisible component in its place, possibly derived from the other end point.
-
Where components form sorted lists, use the merge algorithm to bring semantically corresponding components on a par, introducing invisible components as needed to deal with one-sided merges.
Consider implementing tweens using static Xxx.lerp methods to facilitate reuse in composite
tween implementations. Where significant recomputation happens across calls to Xxx.lerp
for a single animation path, consider moving the computation to the constructor of the XxxTween
class, and let its instances host the computation outcome.
Armed with these insights, we are finally in position to animate more complex charts. We’ll do stacked bars, grouped bars, and stacked+grouped bars in quick succession:

- Stacked bars are used for data sets where categories are two-dimensional and it makes sense to add up the numerical quantity represented by bar heights. An example might be revenue per product and geographical region. Stacking by product makes it easy to compare product performance in the global market. Stacking by region shows which regions are important.

- Grouped bars are also used for data sets with two-dimensional categories, but where it is not meaningful or desirable to stack the bars. For instance, if the numeric quantity is market share in percent per product and region, stacking by product makes no sense. Even where stacking does makes sense, grouping can be preferable as it makes it easier to do quantitative comparisons across both category dimensions at the same time.
- Stacked+grouped bars support three-dimensional categories, like revenue per product, geographical region, and sales channel.

In all three variants, animation can be used to visualize data set changes, thus introducing an additional dimension (typically time) without cluttering the charts.
For the animation to be useful and not just pretty, we need to make sure that we lerp only between semantically corresponding components. So the bar segment used to represent the revenue for a particular product/region/channel in 2016 should be morphed into one representing revenue for the same product/region/channel in 2017 (if present).
The merge algorithm can be used to ensure this. As you may have guessed from the preceding discussion, merge will be put to work at multiple levels, reflecting the dimensionality of the categories. We’ll merge stacks and bars in stacked charts, groups and bars in grouped charts, and all three in stacked+grouped charts.
To accomplish that without a lot of code duplication, we’ll abstract the merge algorithm into a general utility, and put it in a file of its own,
tween.dart:
import 'package:flutter/animation.dart';
import 'package:flutter/material.dart';
abstract class MergeTweenable<T> {
T get empty;
Tween<T> tweenTo(T other);
bool operator <(T other);
}
class MergeTween<T extends MergeTweenable<T>> extends Tween<List<T>> {
MergeTween(List<T> begin, List<T> end) : super(begin: begin, end: end) {
final bMax = begin.length;
final eMax = end.length;
var b = 0;
var e = 0;
while (b + e < bMax + eMax) {
if (b < bMax && (e == eMax || begin[b] < end[e])) {
_tweens.add(begin[b].tweenTo(begin[b].empty));
b++;
} else if (e < eMax && (b == bMax || end[e] < begin[b])) {
_tweens.add(end[e].empty.tweenTo(end[e]));
e++;
} else {
_tweens.add(begin[b].tweenTo(end[e]));
b++;
e++;
}
}
}
final _tweens = <Tween<T>>[];
@override
List<T> lerp(double t) => List.generate(
_tweens.length,
(i) => _tweens[i].lerp(t),
);
}
The MergeTweenable<T> interface captures precisely what is needed to be able to create a tween of two sorted lists of
Ts by merging. We’ll instantiate the type parameter T with Bar,
BarStack, and BarGroup, and make all these types implement MergeTweenable<T>
(diff).
The stacked (diff), grouped (diff), and stacked+grouped (diff) implementations have been written to be directly comparable. I encourage you to play around with the code:
Change the number of groups, stacks, and bars created by
BarChart.random.-
Change the color palettes. For stacked+grouped bars I’ve used a monochrome palette, because I think that looks nicer. You and your UX designer may disagree.
-
Replace
BarChart.randomand the floating action button with a year selector and createBarChartinstances from realistic data sets. Implement horizontal bar charts.
-
Implement other chart types (pie, line, stacked area). Animate them using
MergeTweenable<T>or similar. Add chart legends and/or labels and axes, then animate those too.
The tasks of the last two bullets are quite challenging. Have fun.
More from Flutter

Meet the Flutter Extension for Gemini CLI
Build high quality, feature rich apps with the new Flutter Extension for Gemini CLI

Unleash new AI capabilities for Flutter in Firebase Studio
Flutter development just got a lot smarter in Firebase Studio! At I/O Connect India, we unveiled new AI-powered features designed to give…